Learning on-the-fly is not the best option
One of the benefits of Power BI is the wealth of support available from Microsoft. Directly from the Help menu in the Power BI Desktop ribbon, you can access a range of different resources, each of which links to web or YouTube pages updated with the latest content.
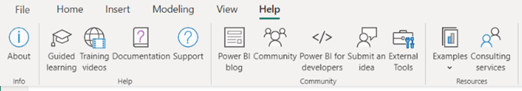 The Help menu in Power BI Desktop is a useful gateway to support in different formats.
The Help menu is a convenient one-stop-shop to access support, but the volume of information is considerable and it’s not easy for a newcomer to plot a course through it.
It’s tempting to dive in and try to learn through experimentation and trial-and-error. This was the approach I took when I first started to learn Power BI. I had the notion that “Guided Learning” would take too long and felt that “Documentation” was the right place to start. Clicking on this option took me to an article within the formal Power BI documentation, “Get started with Power BI desktop”. A twenty-minute read that I followed up with an introductory tutorial I found on YouTube (can’t recall which one specifically) and I was good to go, or so I thought.
I pulled data in from Excel and started dropping visuals onto the page. It was quite a revelation for me to be able to add to my data in Excel and refresh my visuals in Power BI. This dynamic nature of updating reports and dashboards was not familiar to me. (I wouldn’t want to add up the hours I’ve spent in the past updating data in Excel and then copying and pasting graphs in PowerPoint).
So I was hooked on Power BI straight away. But I wasn’t aware of how much I was neglecting the functionality within. Here are some of the mistakes or oversights I made:
Problem 1 – I used Implicit Measures ubiquitously
I didn’t know Explicit Measures existed and the benefits that they bring. Everything I did relied on the Implicit Measures that are built into the visuals. This was fine, at first. I was creating reports and dashboards much faster than I was able to do in the past and my boss was happy.
Problems started to arise when more functionality was needed in the reports. My boss was interested in tracking the proportion of staff members trained in operational excellence across multiple sites, across multiple countries and regions; plus, the ability to have slicers in the report to select one or more specific sites, countries or regions. My Implicit Measures couldn’t cope and, after implementing quite a few time-consuming workarounds, I realised a different approach was needed.
Implicit Measures are restricted in their options.
Problem 2 - I ignored Power Query
“Why complicate things with Power Query?”, I thought, “Surely I can prep my data in Excel?”. I knew that Power BI needed data in a columnar format and that each column could only represent a single field. So, I worked in Excel to transform my data tables from matrix format to columnar format using indexing functions. There are benefits to doing this, covered in another blog Common mistakes with Power BI and how to avoid them. But Power Query has some ETL (Extract, Transform, Load) tools that are not easy to replicate in Excel. One such tool is “Merge”, well known to users of SQL. Merging two different datasets is quick and easy in Power Query. Trying to do everything in Excel was detrimental to efficiency. One of the important lessons I have learned since is that there is a balance between what and how much you should do in Excel and what should be deferred to Power Query to prepare the data.
Problem 3 – I avoided data modelling
Another belief I had was that I could create one big flat file in Excel, from which all my visuals could be driven. Many Power BI experts have explained why one single flat file is less efficient and offers less functionality than the best practice “star schema”, and it’s beyond the scope of this blog. However, suffice to say that what I soon found was the amount of time I was spending in Excel, trying to create such an all-conquering data table, was getting comparable to the time I used to spend copying and pasting graphs into PowerPoint. Again, my work efficiency was being impacted.
Problem 4 – I didn’t use the data connectivity capabilities of Power BI
At the time I started using Power BI, our team was happily reliant on IT to run SQL reports on our databases and dump the reports into a shared folder at an agreed time and frequency. This made it easy for us to access and, at that time, I saw no reason to change the approach. However, these reports were often pivots or aggregations of the source data, so the level of detail (“grain”) was out of our control. Also, reports often lacked fields that would be useful for analysis, and to add them would require a change request formally submitted to IT which would be prioritised (usually low priority), and added to an already long queue. Instead of utilising the self-service connectors in Power BI, I persevered trying to do everything through Excel.
These were some of the main problems, among others, that I can recollect. I was doing as much as possible in Excel and then trying to make a direct leap to report visuals, missing out on much of Power BI’s capabilities. As projects became more complex, the approach I was taking became unfeasible.
It's best to understand Power BI's end-to-end capabilities from the outset.
As complexity of reports increased my efficiency in creating them dropped, and I realised that I needed to take a step back and re-evaluate how I was using Power BI. Taking a week to learn the fundamentals of Power BI correctly was a good decision. I regained that time very quickly, through being much more efficient and effective in the way I pulled the data together; transformed the data; created a data model with Explicit Measures; and used those Measures to drive functionality in my report design.
So, having recognised the mistakes I made early on, this is how I would advise a newcomer to Power BI.
The Starting Point – Microsoft Learn
Microsoft Learn (accessed through Power BI Desktop help menu or Power BI on Microsoft Learn | Microsoft Learn) is comprehensive and divided up into different themes.

Step 1 – Learn the fundamentals end-to-end
At the time of writing, Microsoft offers 100 free online learning modules just for Power BI, ranging from about 10 minutes to over two hours. These modules are consolidated in 30 learning paths. For example, there is a “Consume data with Power BI” learning path, specifically for report end-users. For content creators, Microsoft consolidates learning paths into collections:
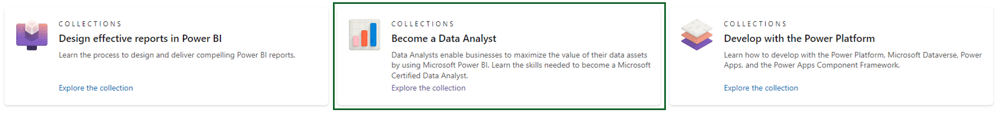
The collection “Become a Data Analyst” has been renamed “Become a Power BI data analyst” and can be accessed here: Collections - MicrosoftPowerPlatform-5978 | Microsoft Learn. It covers the following learning paths to provide an essential foundation of Power BI knowledge:
- Get started with Microsoft data analytics
- Prepare data for analysis
- Model data in Power BI
- Visualise data in Power BI
- Data analysis in Power BI
- Manage workspaces and datasets in Power BI
These learning paths cover about 18 hours of self-paced learning that can comfortably be covered in 3 days. They also include labs using a virtual machine, accessed through your browser, to give hands-on practice. What’s more, this collection prepares you for a certification exam, PL-300: Microsoft Power BI Data Analyst (https://docs.microsoft.com/en-us/learn/certifications/data-analyst-associate). There is a cost to take this exam (at time of writing US$165 or approx. £140). It can be taken online and you will gain a formal Microsoft qualification to demonstrate your capability.
Step 2 – Learn specific subject areas in more detail
Again, Microsoft Learn provides all you need initially. There are more advanced learning paths that take each subject area of Power BI into greater detail:
“Become a Power BI data analyst” collection will provide a good foundation across the spectrum of Power BI subject areas.
Other learning paths provide more detailed self-paced learning in specific topics.
Step 3 – Mix it up with YouTube content
Microsoft Learn contains great training content, but there’s generally a lot of reading to do. The same topics are covered by YouTube channels; sometimes this is a good alternative that helps explain the concepts. You’ll converge on your favourite channels over time, but here are some recommended ones:
SQLBI - YouTube – experts in DAX and data modelling
Microsoft Power BI - YouTube – Microsoft’s own channel for Power BI, includes monthly release updates
Guy in a Cube - YouTube – all things Power BI and related topics
Pragmatic Works - YouTube – has some end-to-end training courses lasting around 3 hours (e.g. Power BI Beginner to Pro, Beginning Power BI DAX functions tutorial)
Power BI Tips - YouTube – covers a wide range of Power BI topics
RADACAD – YouTube – also covers various topics
Step 4 - Find specific answers in the Power BI Community
If you perform a web search for a specific question related to Power BI, then there’s a good chance the links will direct you to an answer within the Power BI Community (Home - Microsoft Power BI Community). There are forums that relate to different elements of Power BI (Desktop, Service, Power Query, DAX, etc) and you can be confident that, whatever your question is, it has likely been answered before.
Step 5 - Explore other options to learn
This blog has highlighted some of the most common and trusted methods for learning Power BI; at least for getting started. There are plenty of others, including LinkedIn Learning and third-party websites (for example Enterprise DNA | Empowering Data Analysts to Change Their World, Pragmatic Works - Pragmatic Works). Also search the Power BI documentation from Microsoft for detailed guidance, in addition to the training modules.
Step 6 – Keep up with new developments
The growing popularity of Power BI means that Microsoft are constantly working on improvements, changes and additional functionality. Power BI is on a 1-month release cycle, so it’s worth tuning into the Microsoft Power BI YouTube channel to hear of updates (Microsoft Power BI – YouTube) or through the blog that can be accessed from Power BI Desktop (Power BI Blog—Updates and News | Microsoft Power BI).
Step 7 – Learn through your own experience and that of others, but be realistic about your strengths
Most of us recognise that the breadth of content to cover and depth of knowledge to be gained in Power BI means that we need to temper our ambitions and expectations to our own abilities and the time we have available. Through experience, you should recognise where your strengths and aspirations lie. Are you comfortable working across the full end-to-end, from data connection through to report design, or do you find that you naturally gravitate towards specific areas? For example, you might enjoy the challenge of data modelling and DAX, or your preference could be in designing user navigation options for a report. It’s important then to find where complementary experience and knowledge exists within your own organisation and leverage that. Organisations that have a Power BI programme usually have a community of practice where knowledge can be shared and expertise aligned to business needs.
Conclusion
If you need to learn Power BI, especially if you want to create content (data models or reports), then start the right way. There’s too much to cover and learn through experimentation or trial-and-error. While these approaches do have value, that should come later, after you have a solid base of knowledge across the end-to-end capabilities of Power BI. There’s no better place to learn the fundamentals than Microsoft’s own online training. The content is free, well-maintained, kept up-to-date, and offers the opportunity to obtain certification from Microsoft. Once you have that base knowledge, you can focus on specific topics, also through Microsoft Learn. There are a range of options when searching for answers to specific questions, notably the Microsoft Power BI Community, YouTube, and third-party websites. By that stage, you will have identified approaches that work best for you. Remember, it’s important to stay in touch with developments in Power BI; you don’t want to be using old workarounds when new functionality meets your needs better.