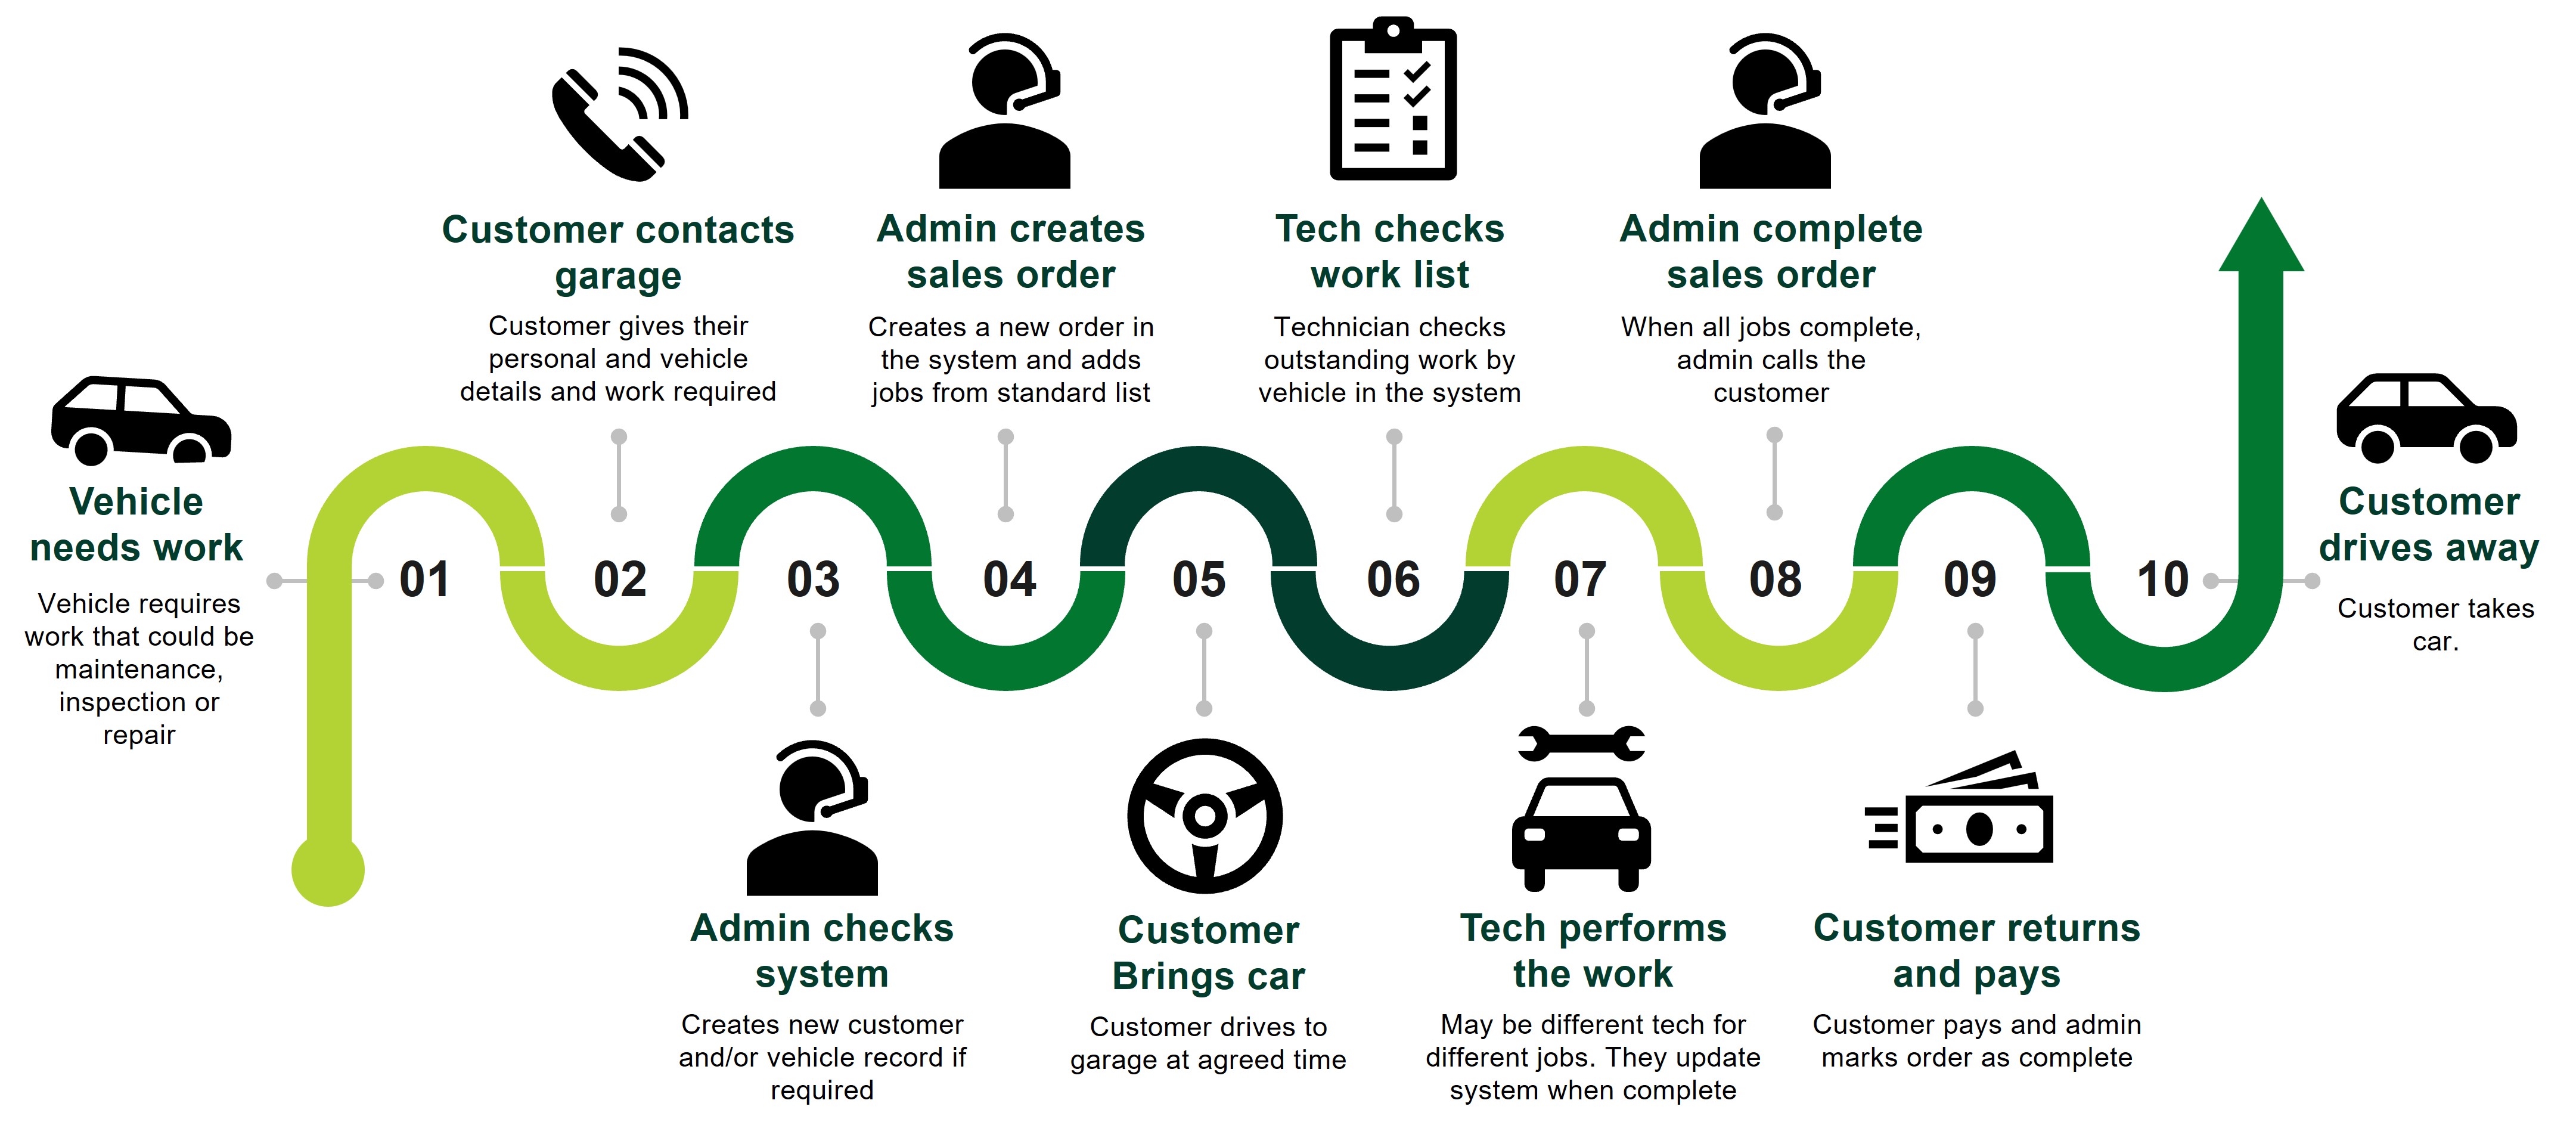
Step 1 - Map the process
You want to make sure you’re designing a solution for the right process, so walk through the steps and “get it down on paper”. In this process when a customer needs some work doing on their car, they contact the garage. The admin user can check the customer details on the system, identify the vehicle (or allocate a new one to that customer) and create a work order. Work orders consist of line items that feed a work list for the Technician users. When a customer brings the car the Techs complete the work, update the work list and then the Admin user can contact the customer when all work is complete. All data for the work undertaken and payments made are stored in the data tables (SharePoint lists) and can be retrieved at any point in time, including for analytics purposes.
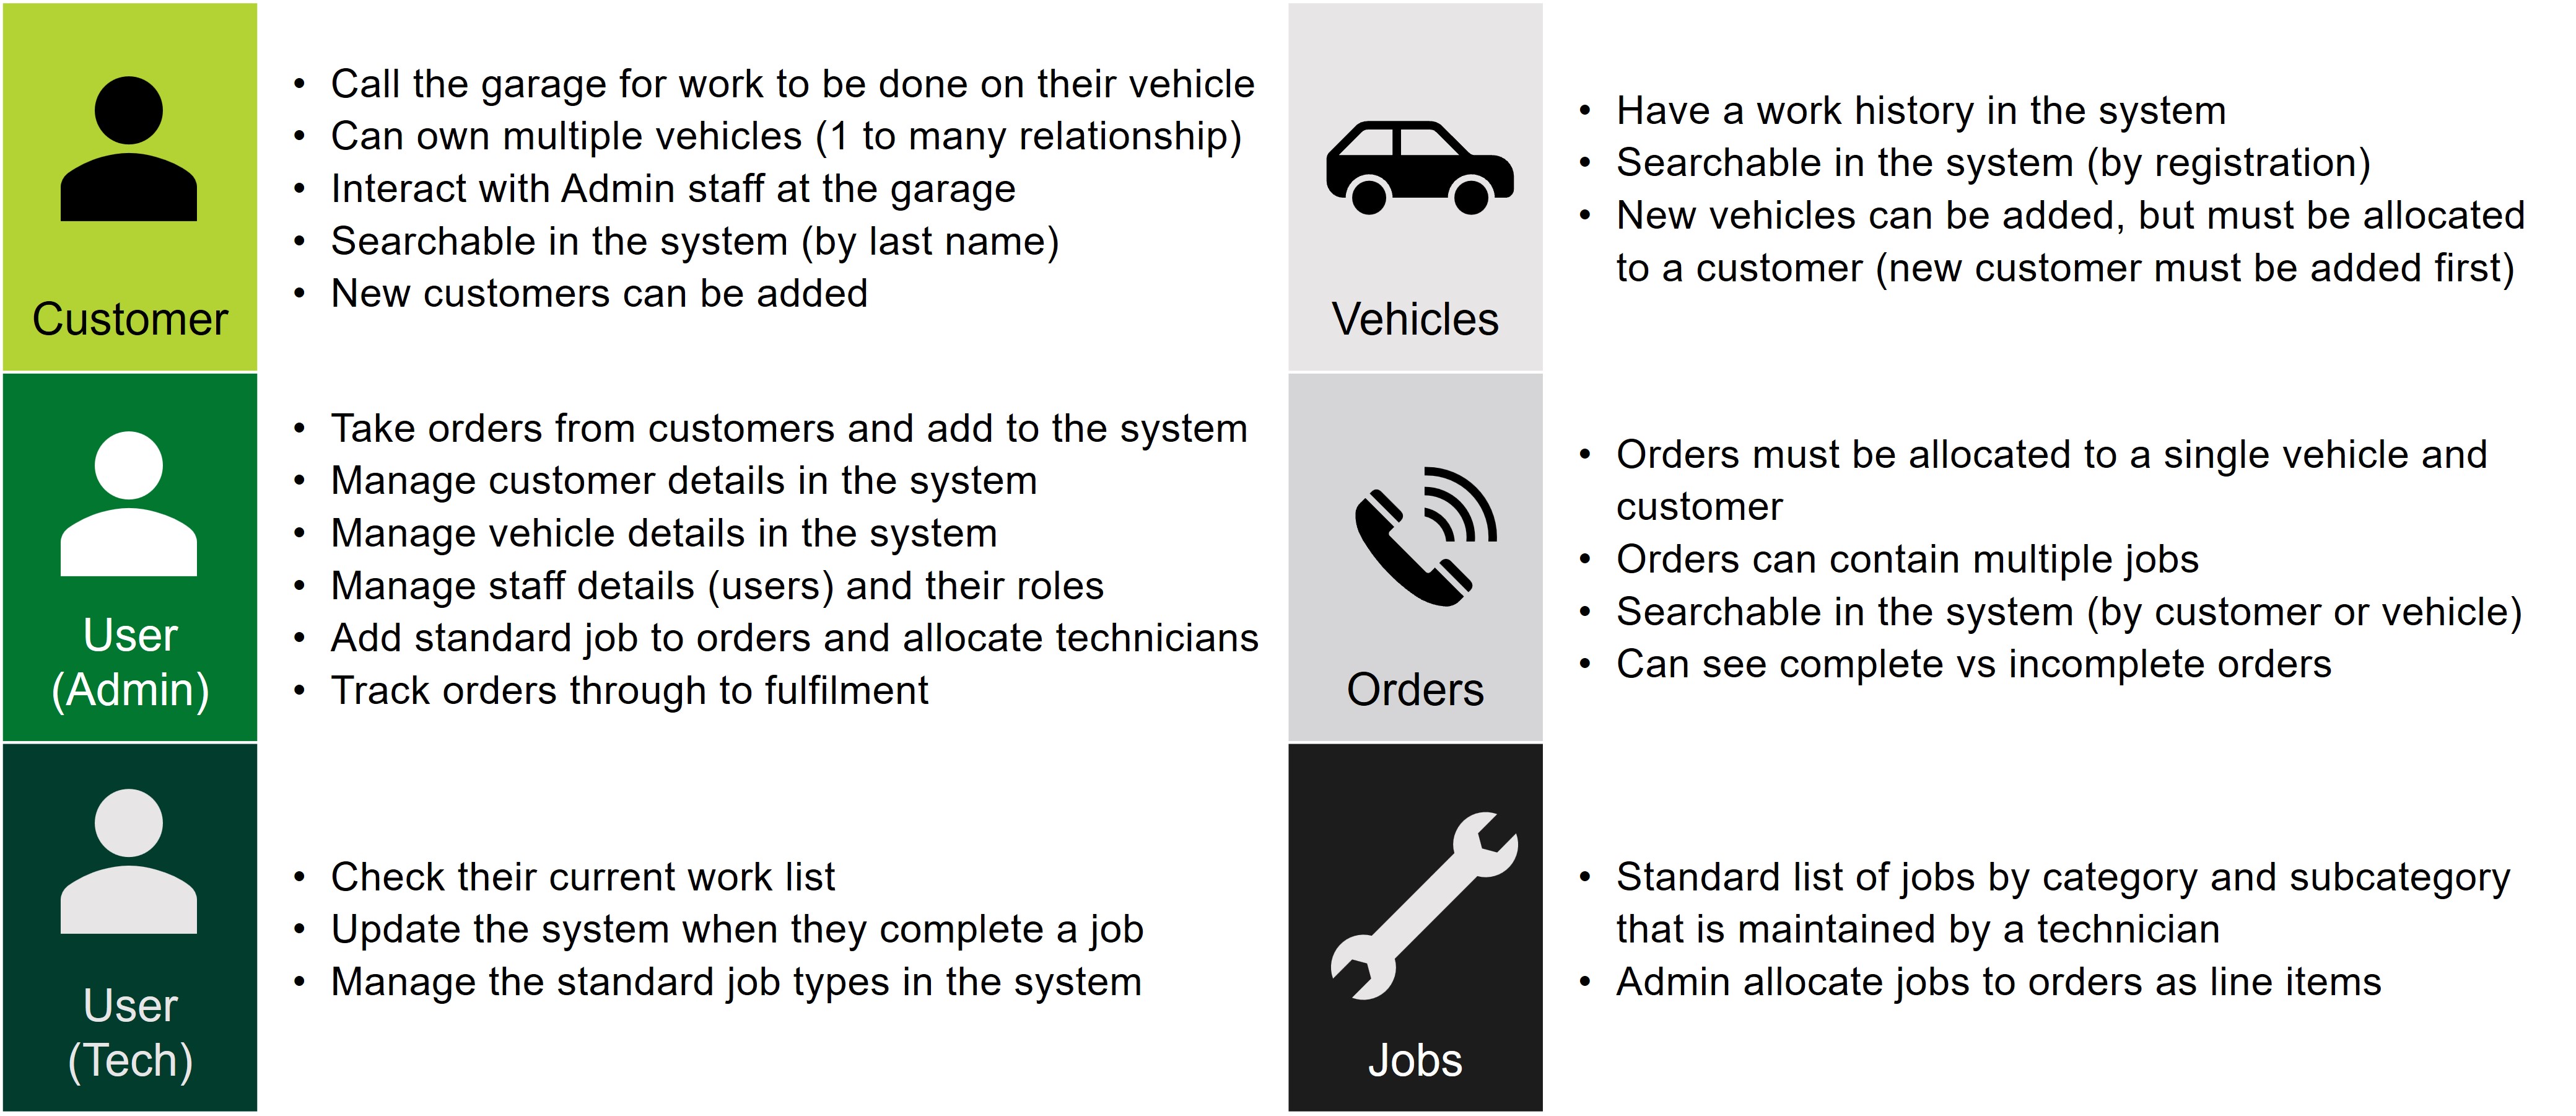
Step 2 – Identify the entities involved and the requirements for each
Mapping the process allows you to identify the entities, which are people and objects involved in the exchange and processing of data. Here the entities are:- Customers
- Admin Users
- Technician Users
- Vehicles
- Orders
- Jobs
For each one, describe how that entity needs to interact with the process and what features and requirements you would like included in your app.
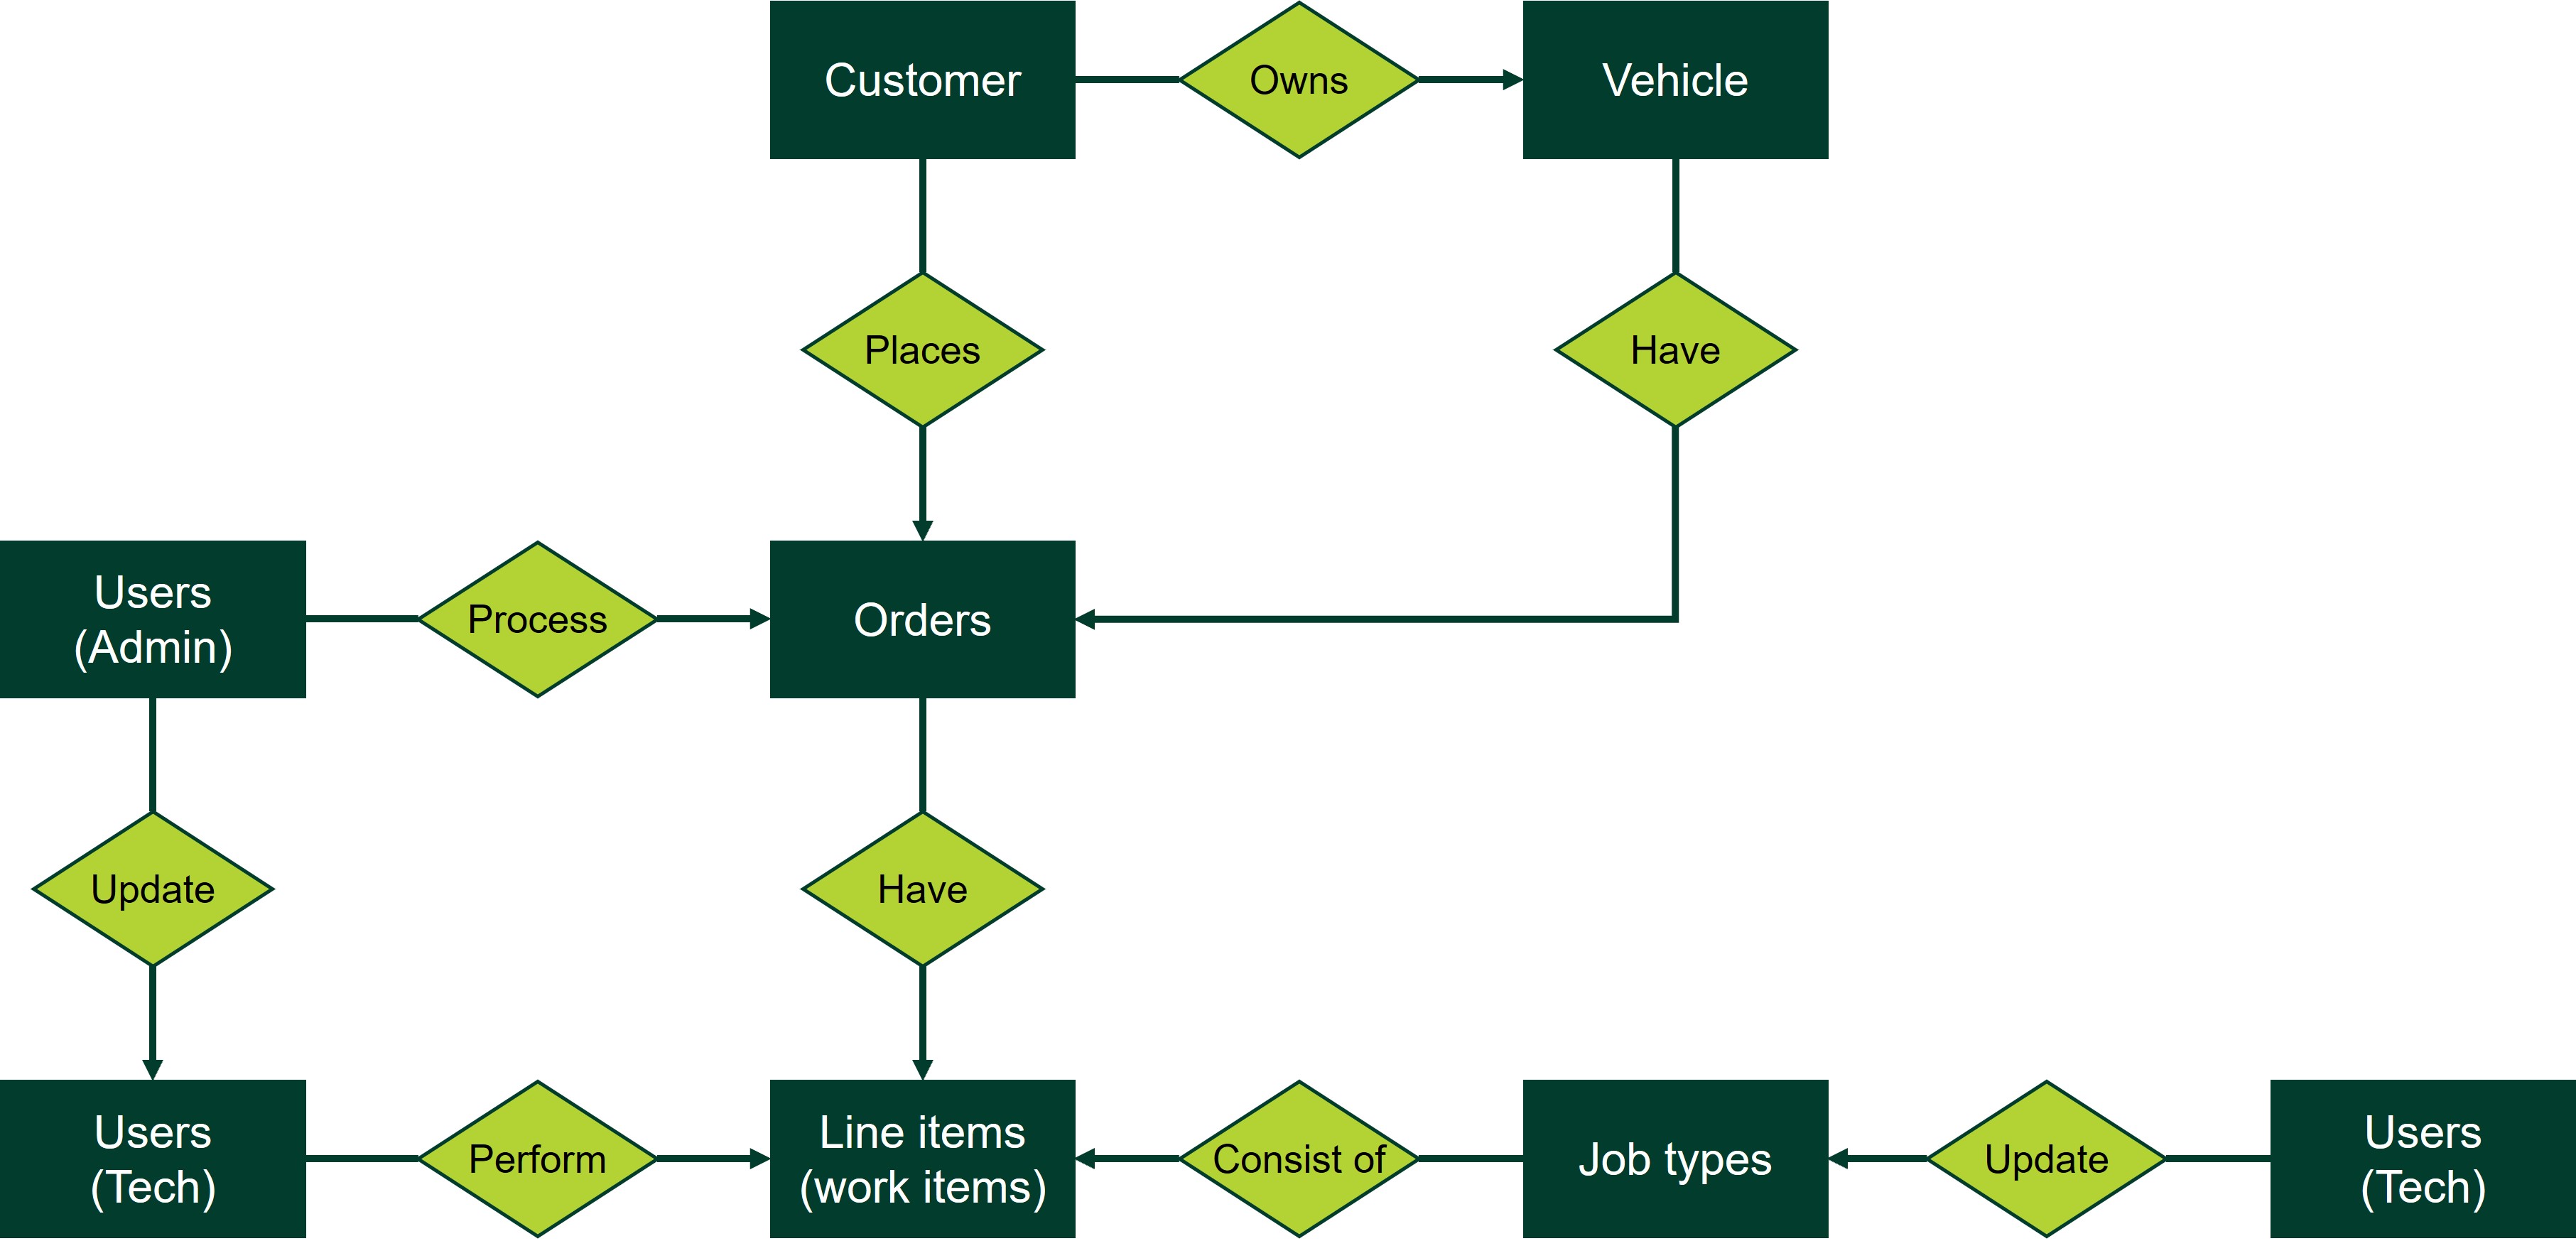
Step 3 – Create a simple Entity-Relationship (ER) diagram
With the entities identified, you can then define how they are related using an Entity-Relationship (ER) diagram. The ER diagram links the entities (nouns) by actions (verbs).
For example:
- Customer places orders
- Customer owns vehicles
- Orders have line items
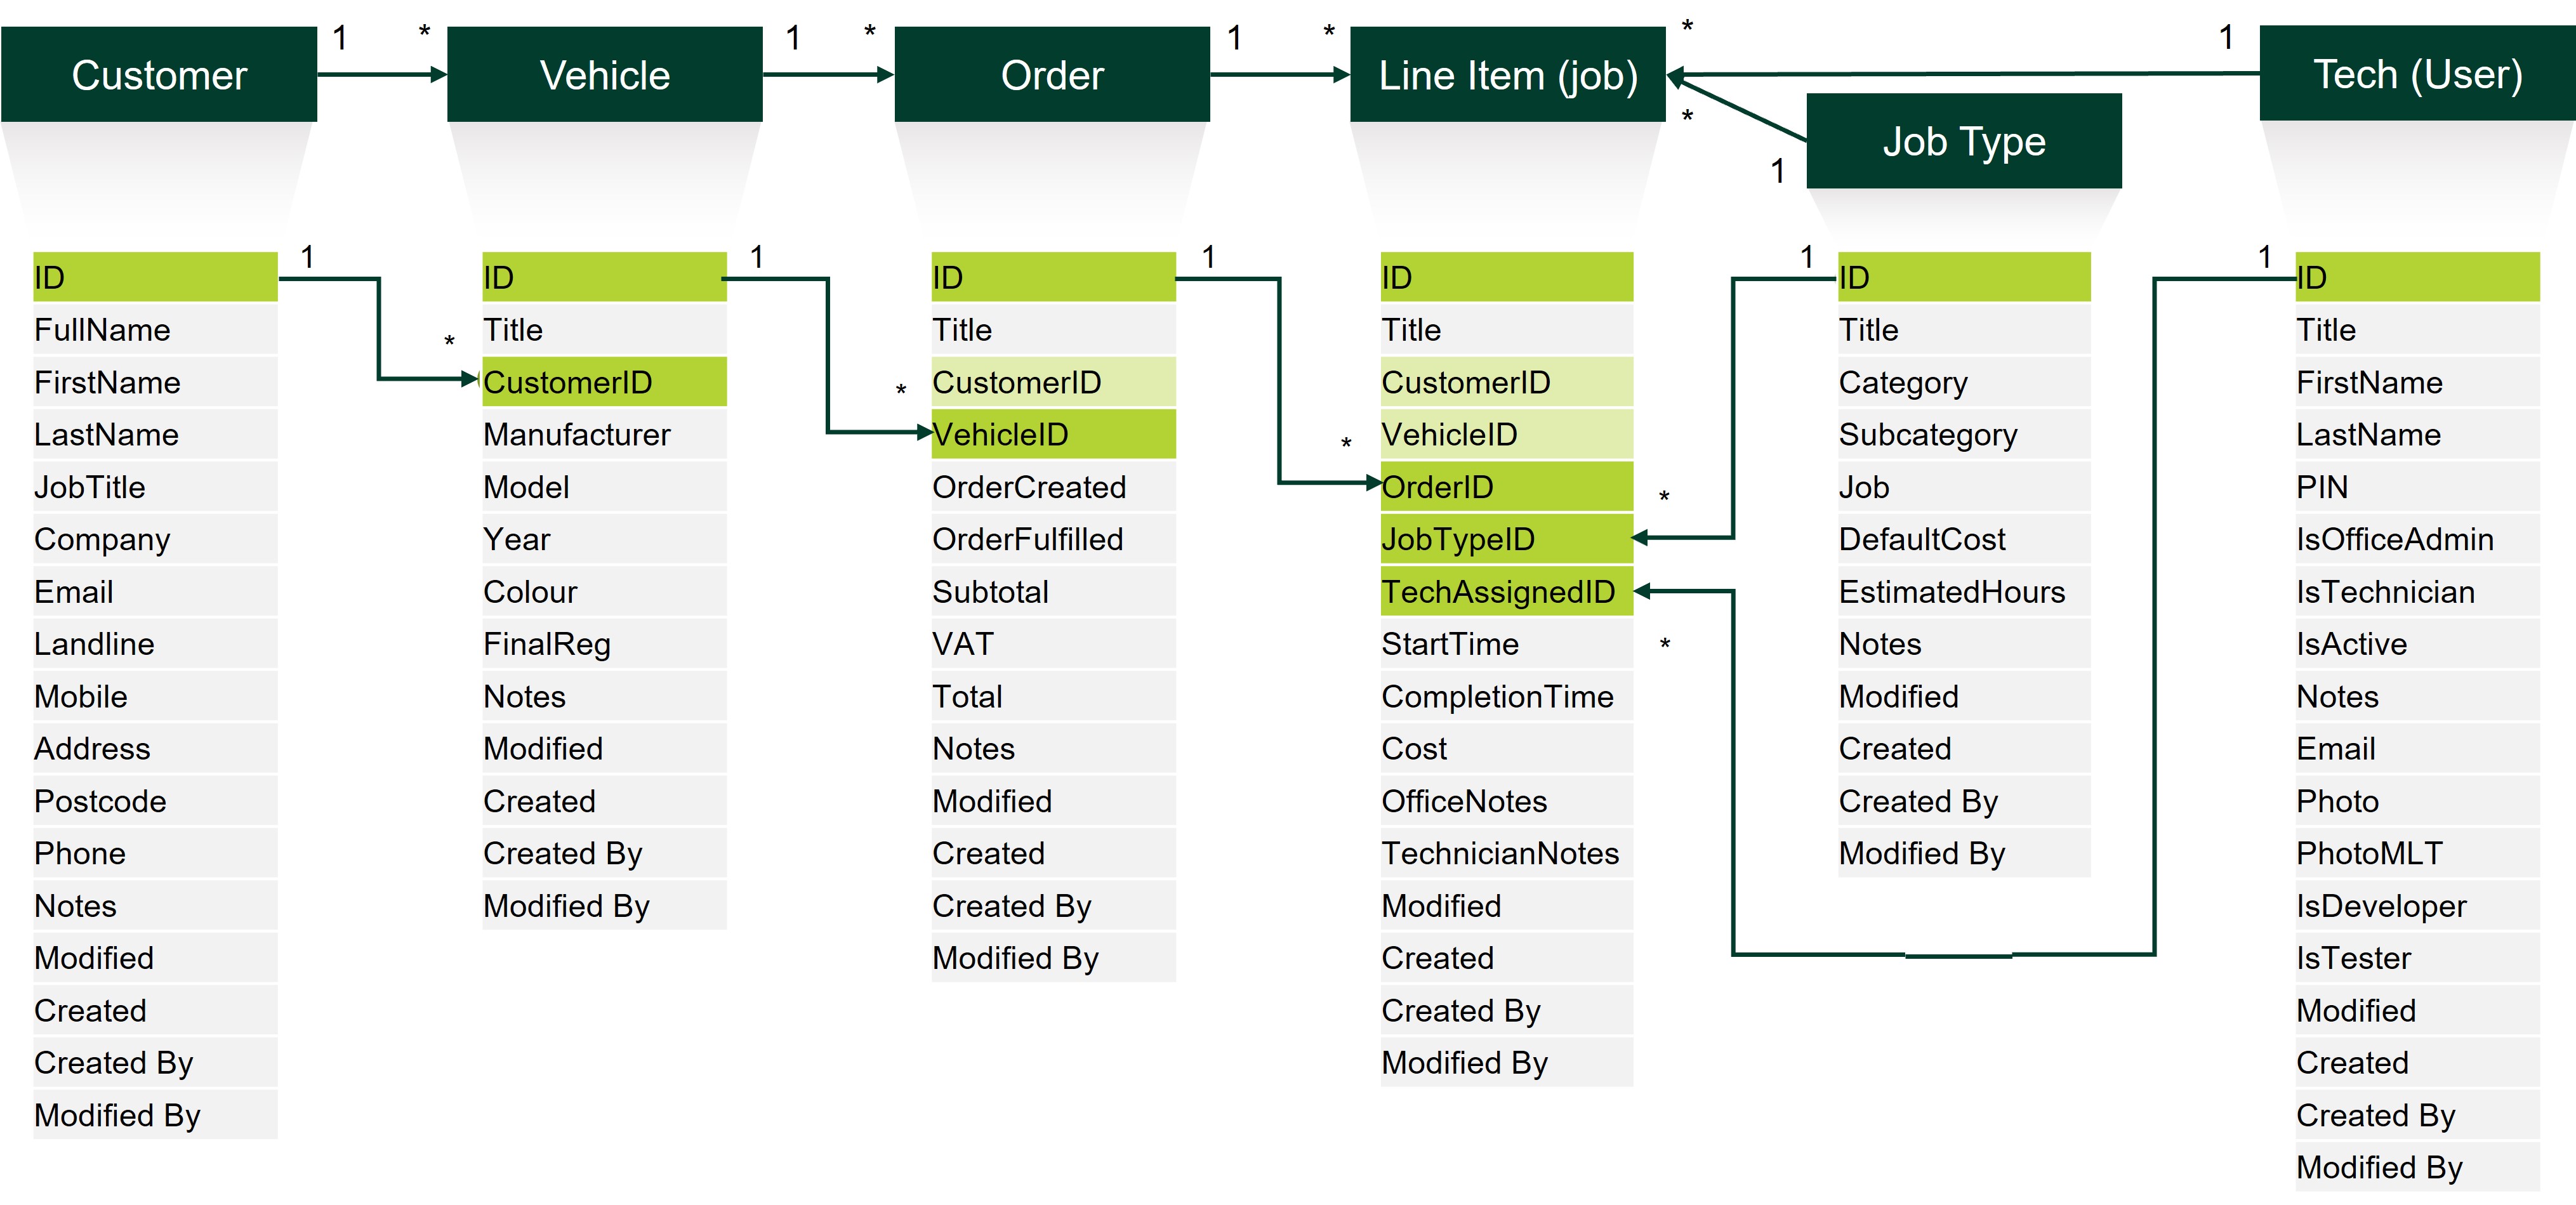
Step 4 – Identify the data contents for each entity in your database (one SharePoint list for each)
Each entity becomes a table that is stored as a SharePoint List. The relationships from your ER diagram show you how to relate your tables together, with tables linked by 1-to-many relationships. This forms the hierarchical structure of your relational database, with parent and child relationships.
For example:
- One customer can own many vehicles
- One vehicle can have many work orders
- One work order can have many line items
Step 5 – Map out the screen navigation through your app
The design process is iterative and will evolve, but it helps to be clear at the outset how you want your app to work. An example of navigation for an Admin user could be:
1. Admin user logs in from the Login screen and lands at the Admin Home screen
2. When a customer calls, the Admin user searches for them on the Customer Listings screen
3. The Customer Details screen shows which vehicles that customer owns
4. The Admin user can select an existing vehicle or register a new one at the Vehicle Details screen
5. The Admin User creates a new order for that vehicle in the Sales Order screen
6. They can then add new line items to the order in the Add / Update Line Items screen
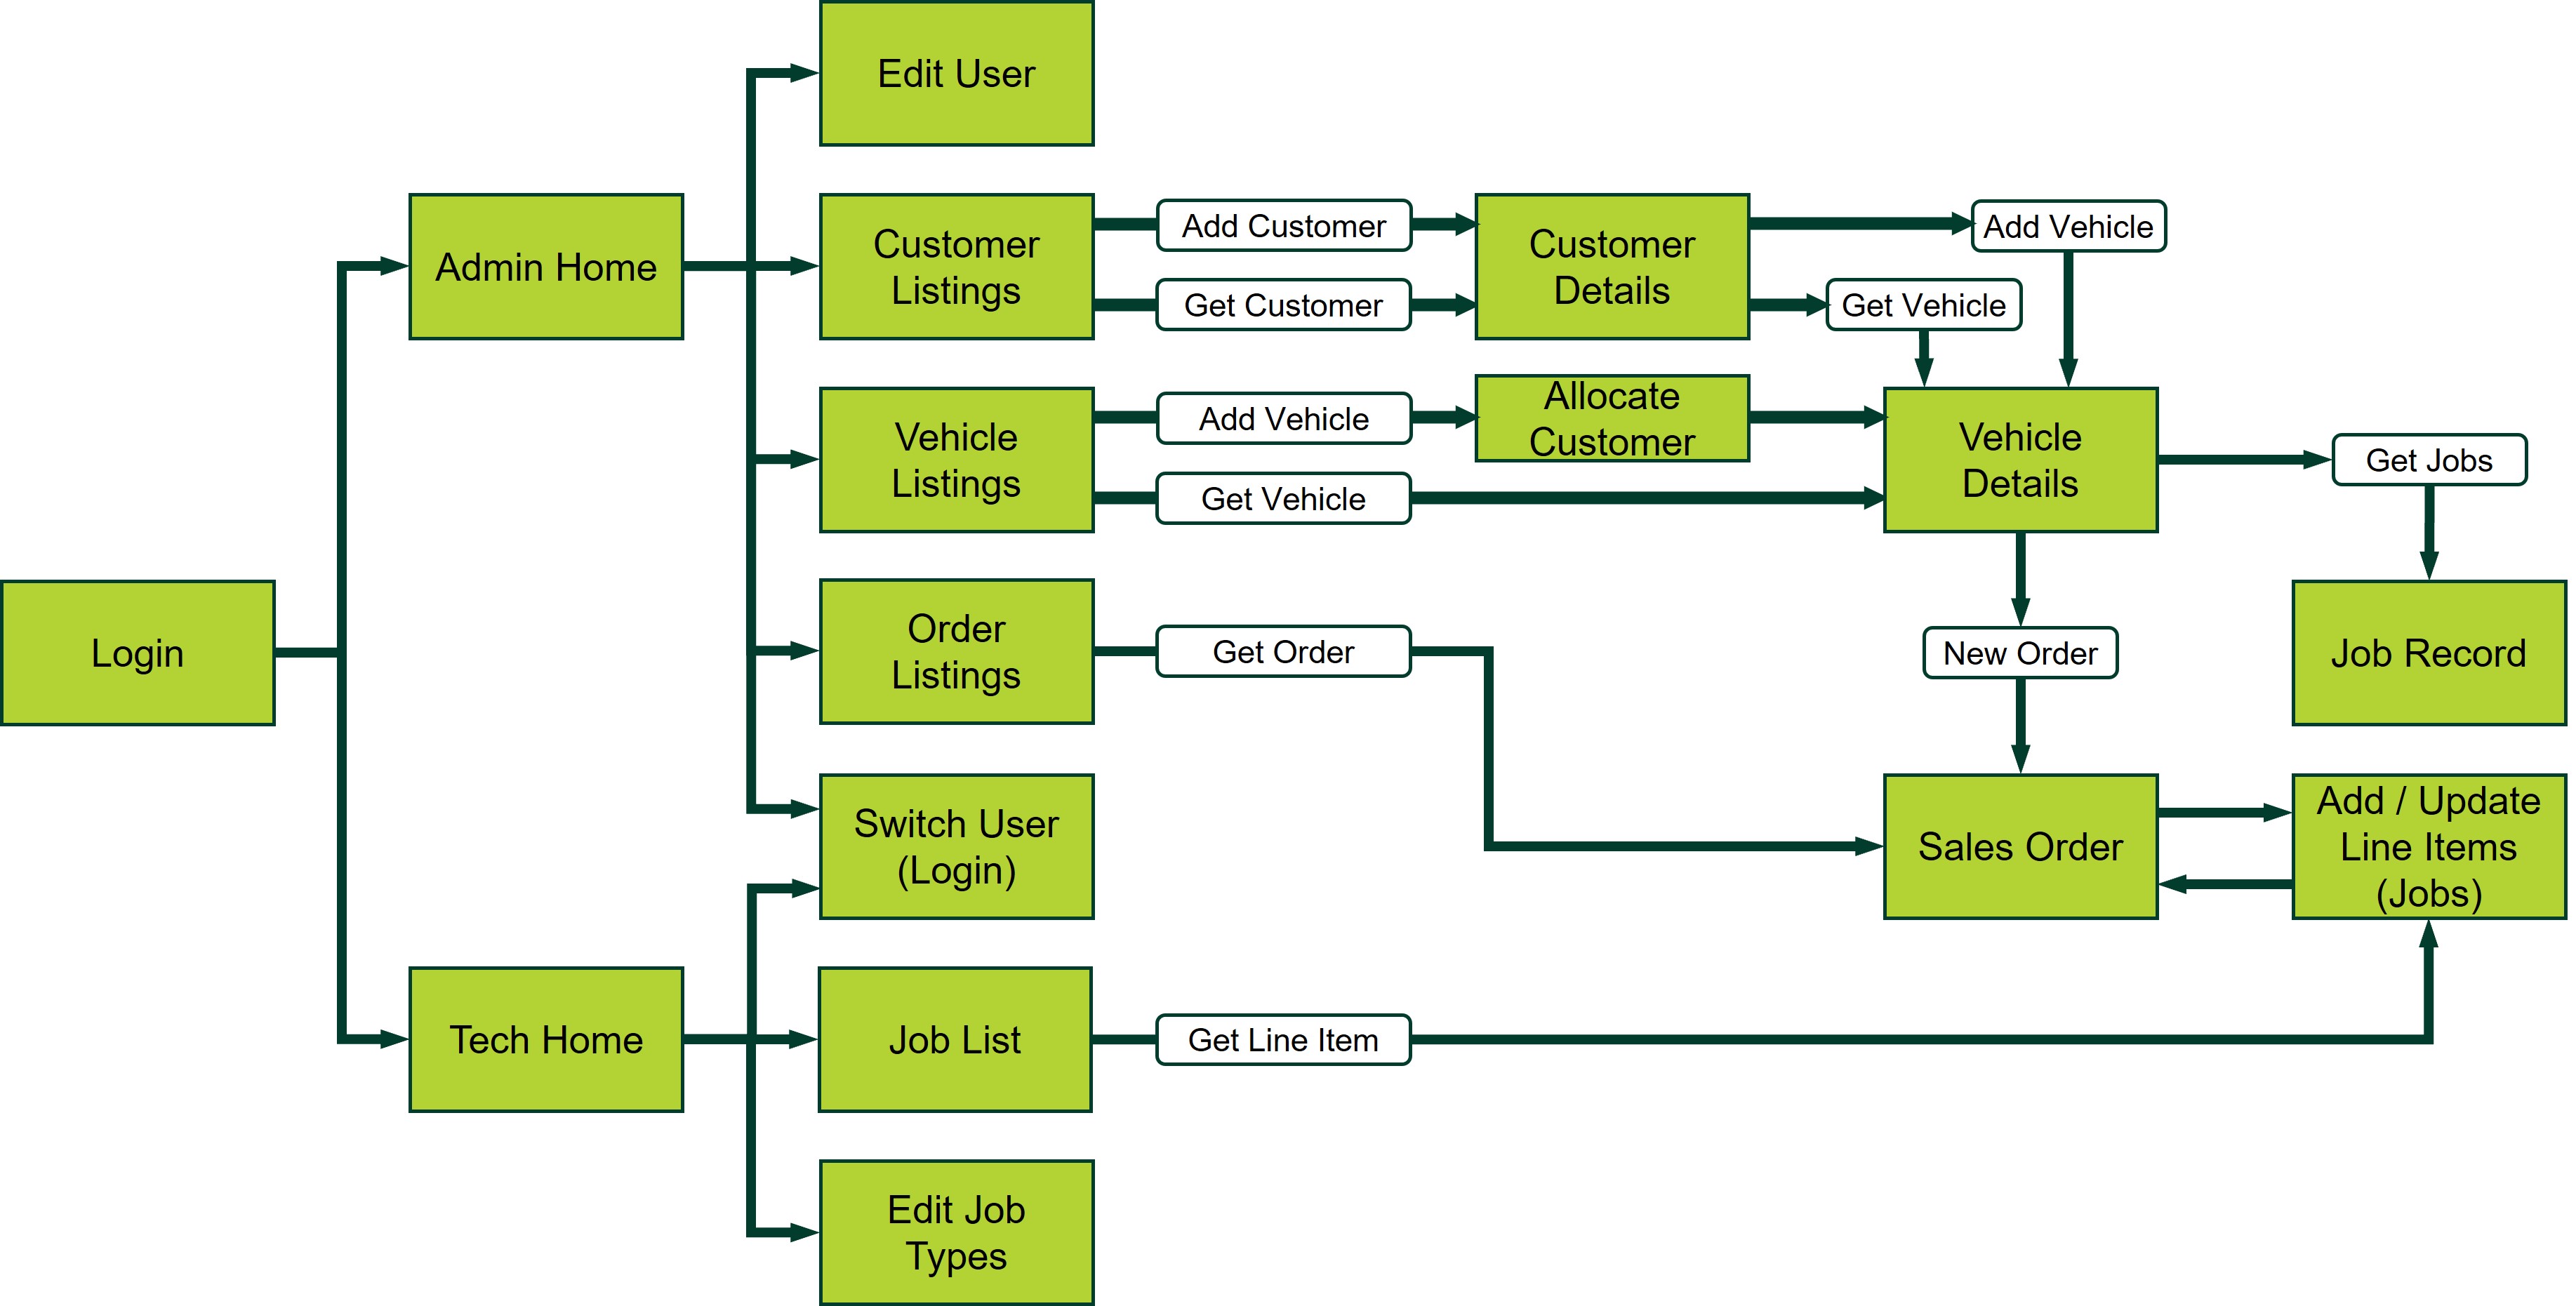
Depending on their role, users will have different navigation options through the app. Admin users have a different navigation experience to Tech users, although sometimes they can navigate to the same screen (for order line items, the Admin user may update costs, while the Tech user updates the status of job completion, both tasks being performed at the Add / Update Line Items screen).
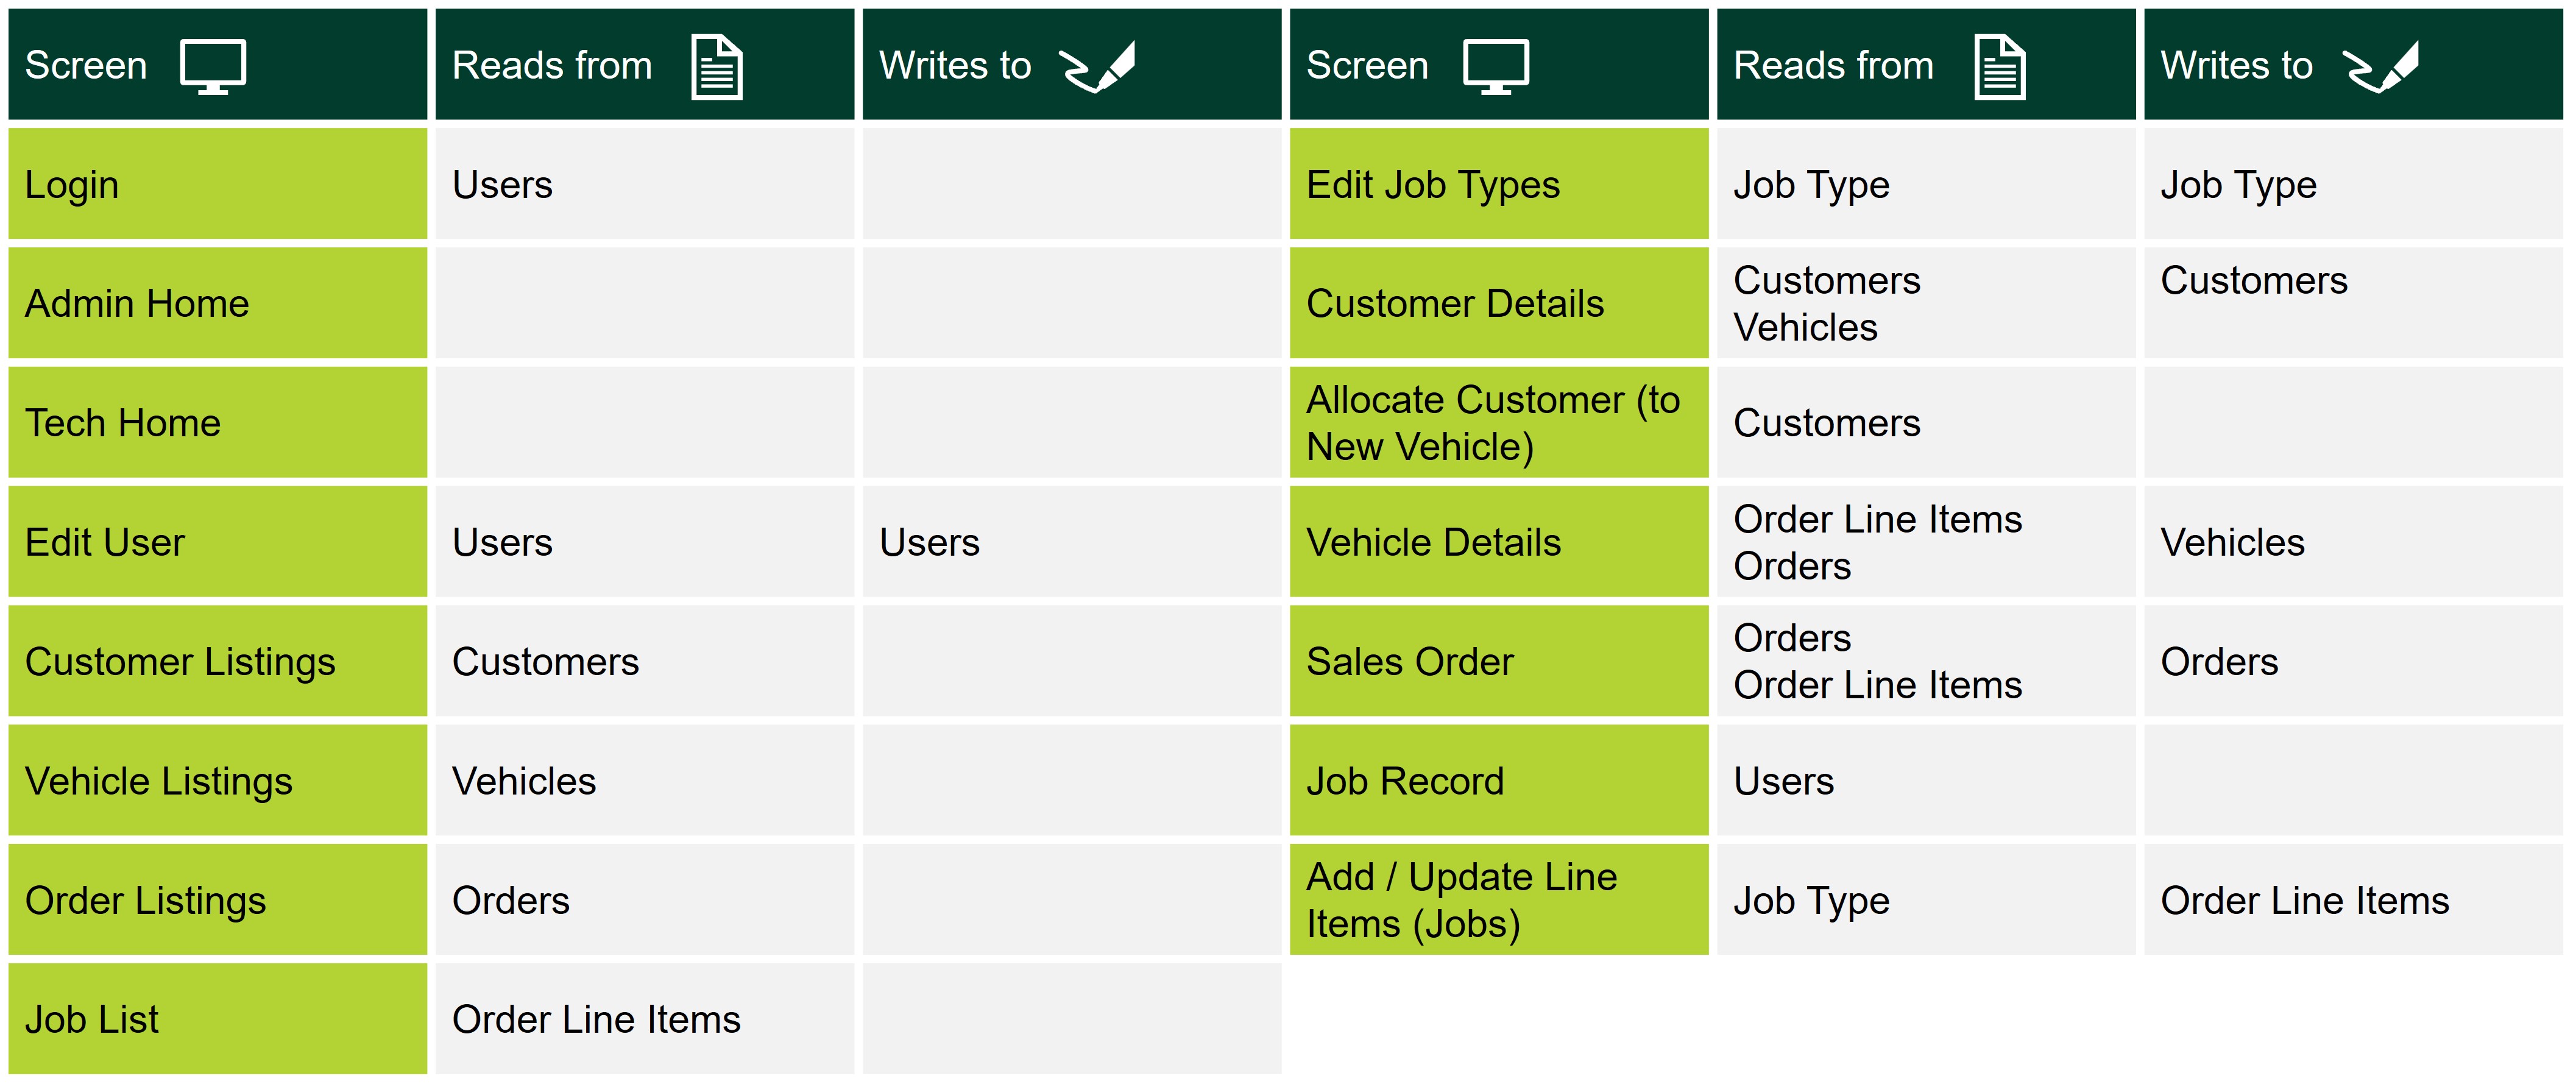
Step 6 - Identify data read and write requirements for each screen
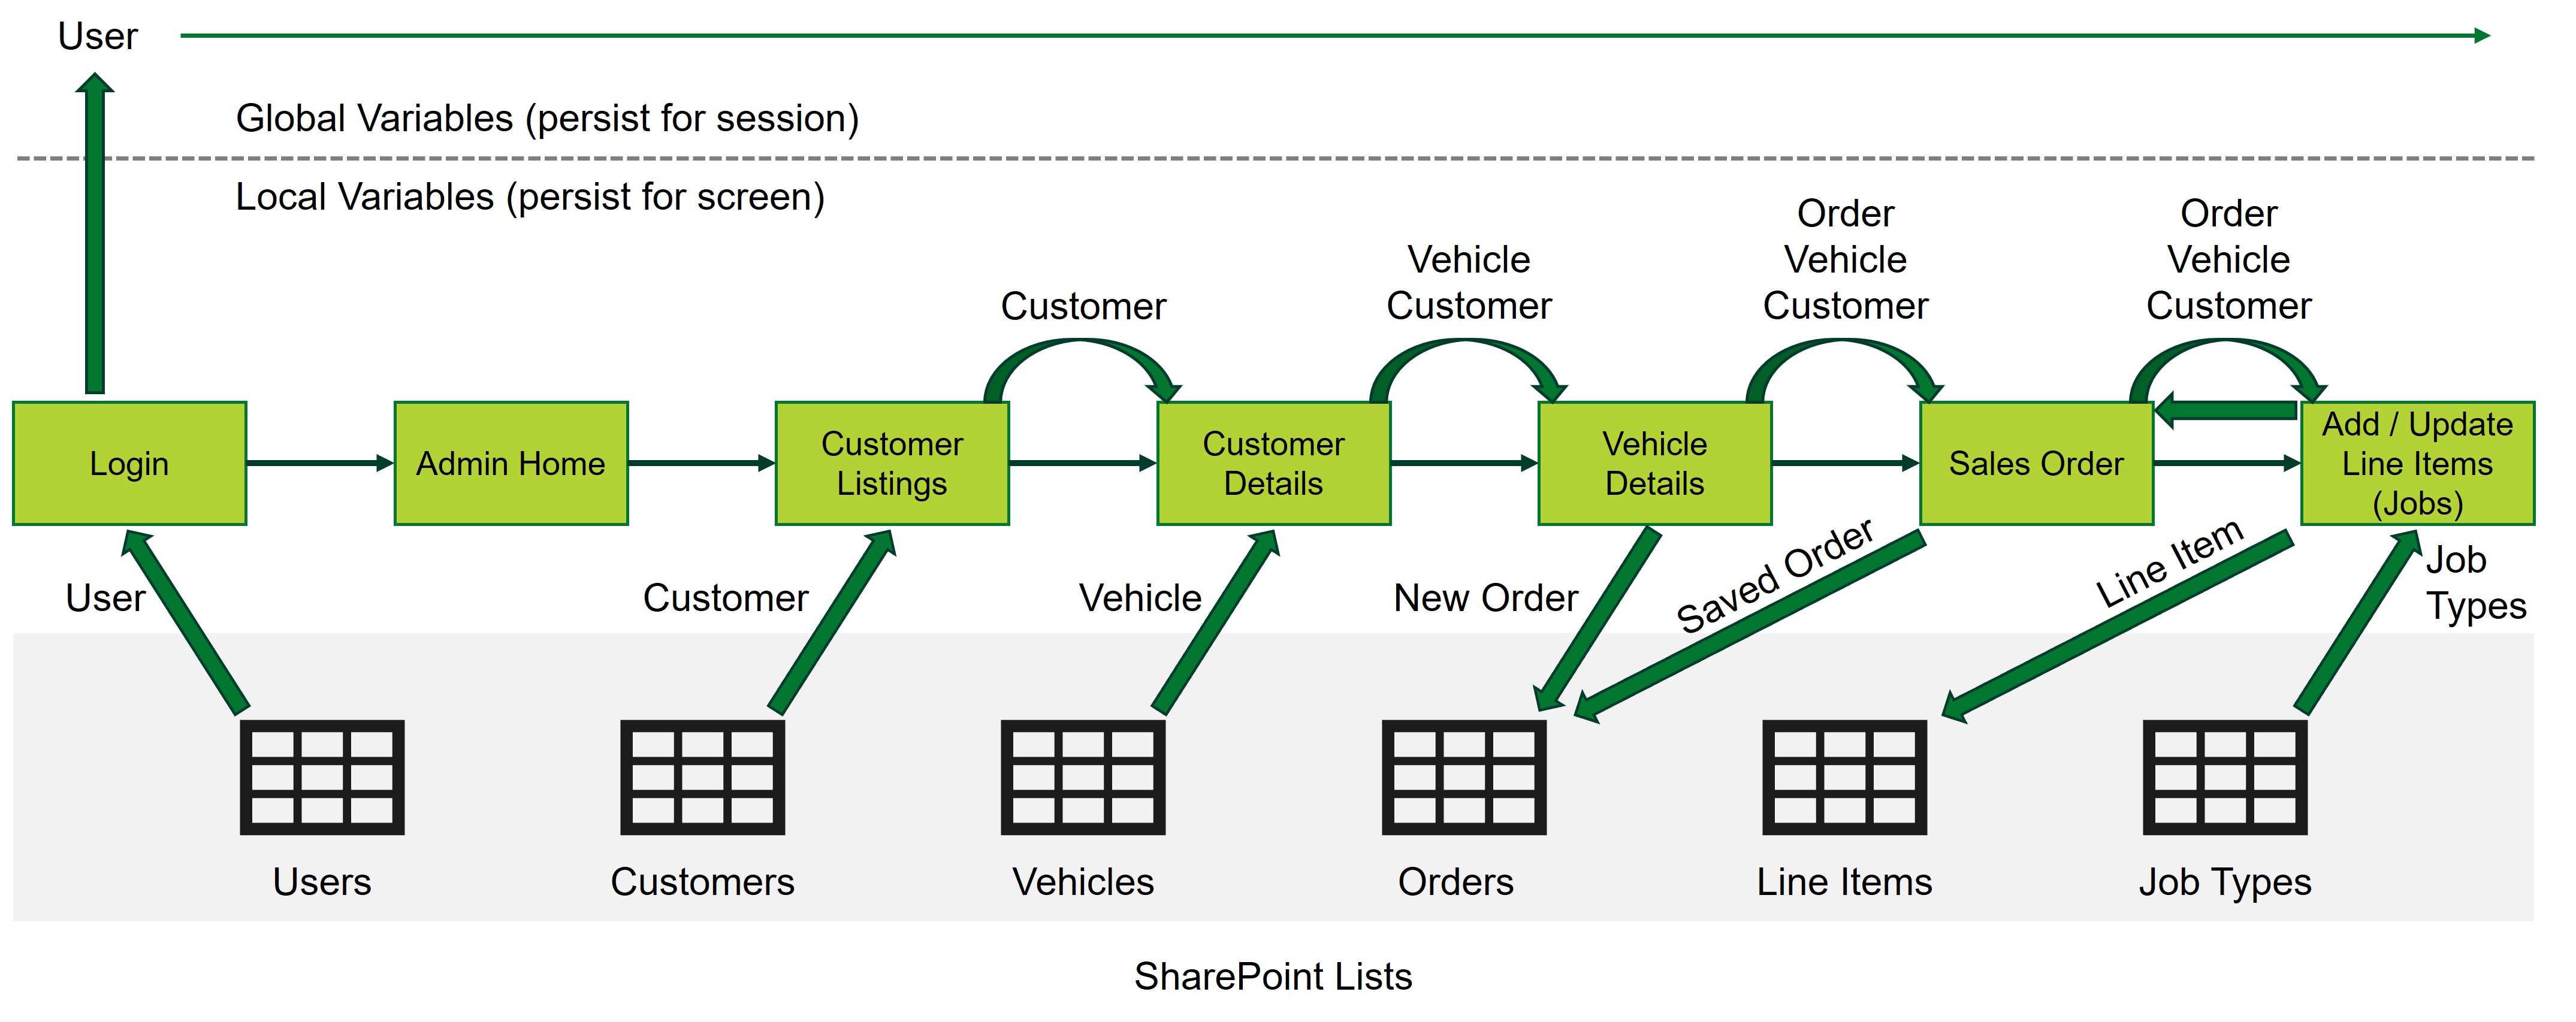
Data exchange within the app, and between the app and SharePoint lists (your database tables), is one of the more challenging aspects of the project, but if you have the right foundations in place and take it screen by screen in logical order then you can work out how the data needs to flow. In this project, data exchange between the Power App and the tables stored as SharePoint lists will follow the protocols below.
As well as reading data from the SharePoint lists, “global” and “local” variables in the app can propagate data through the screens (global variables persisting until changed, while local variables apply to a single screen). For example, if you read the list of customers from the Customers SharePoint list, then select a single customer, that customer record can be passed on through a local variable to the Customer Details screen. This then allows the correct vehicles for that customer to be retrieved from SharePoint (the Vehicles list). It makes for more efficient data management through the app.
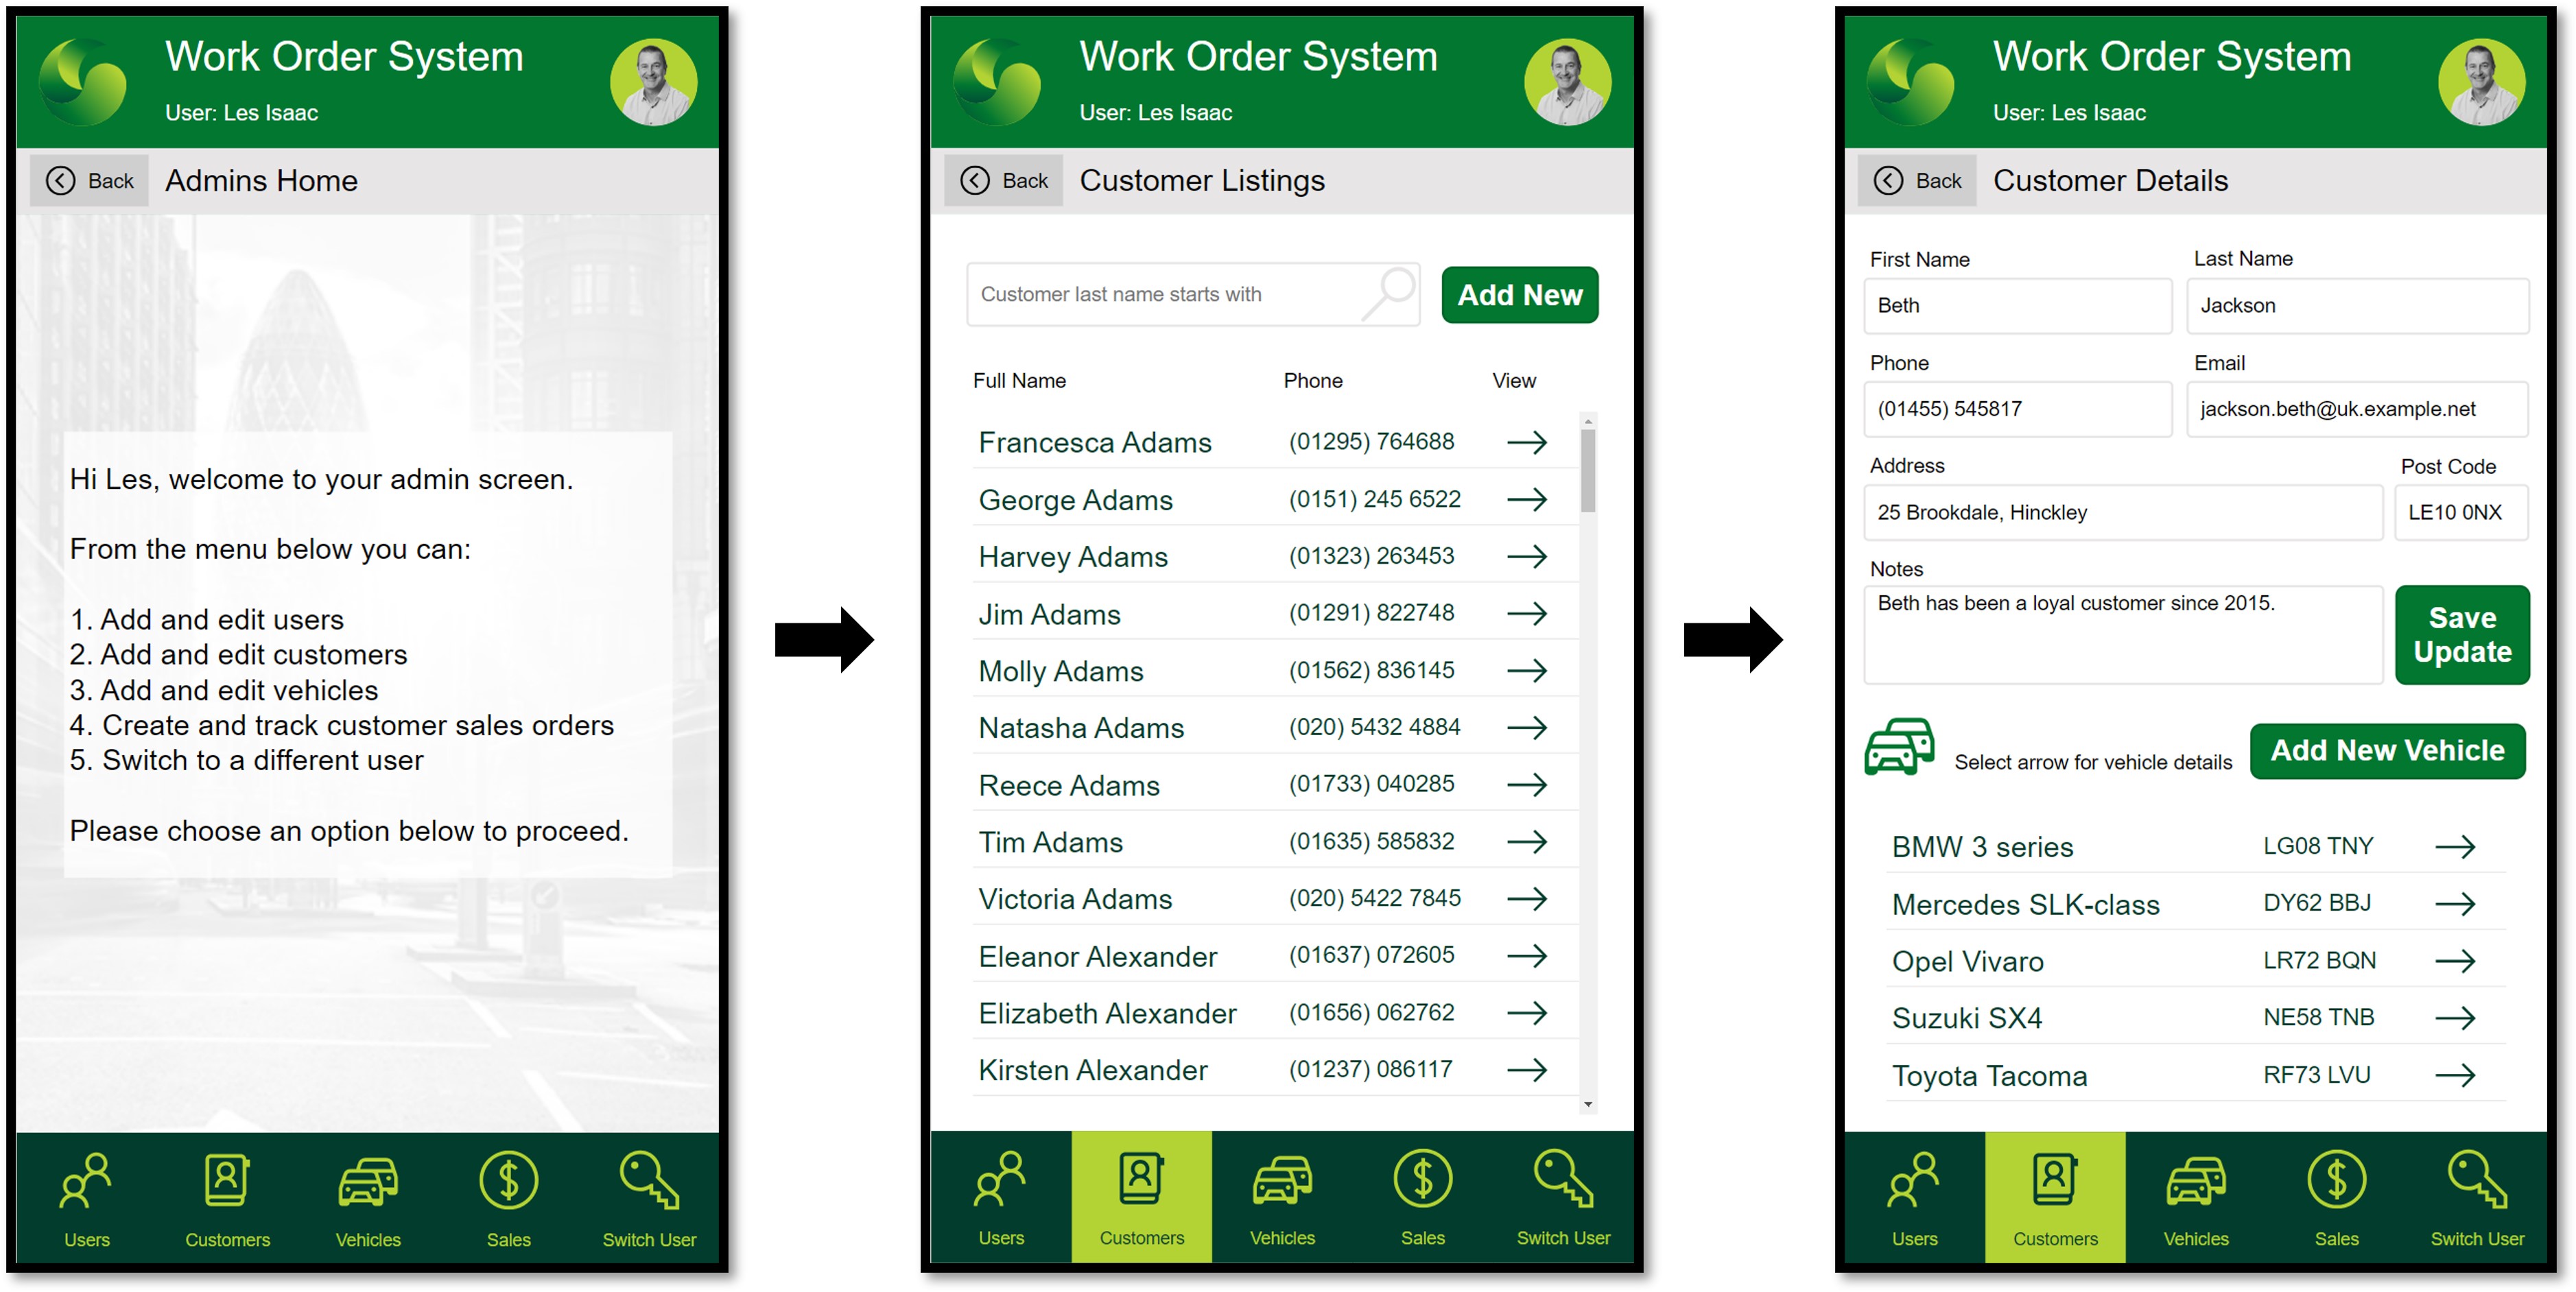
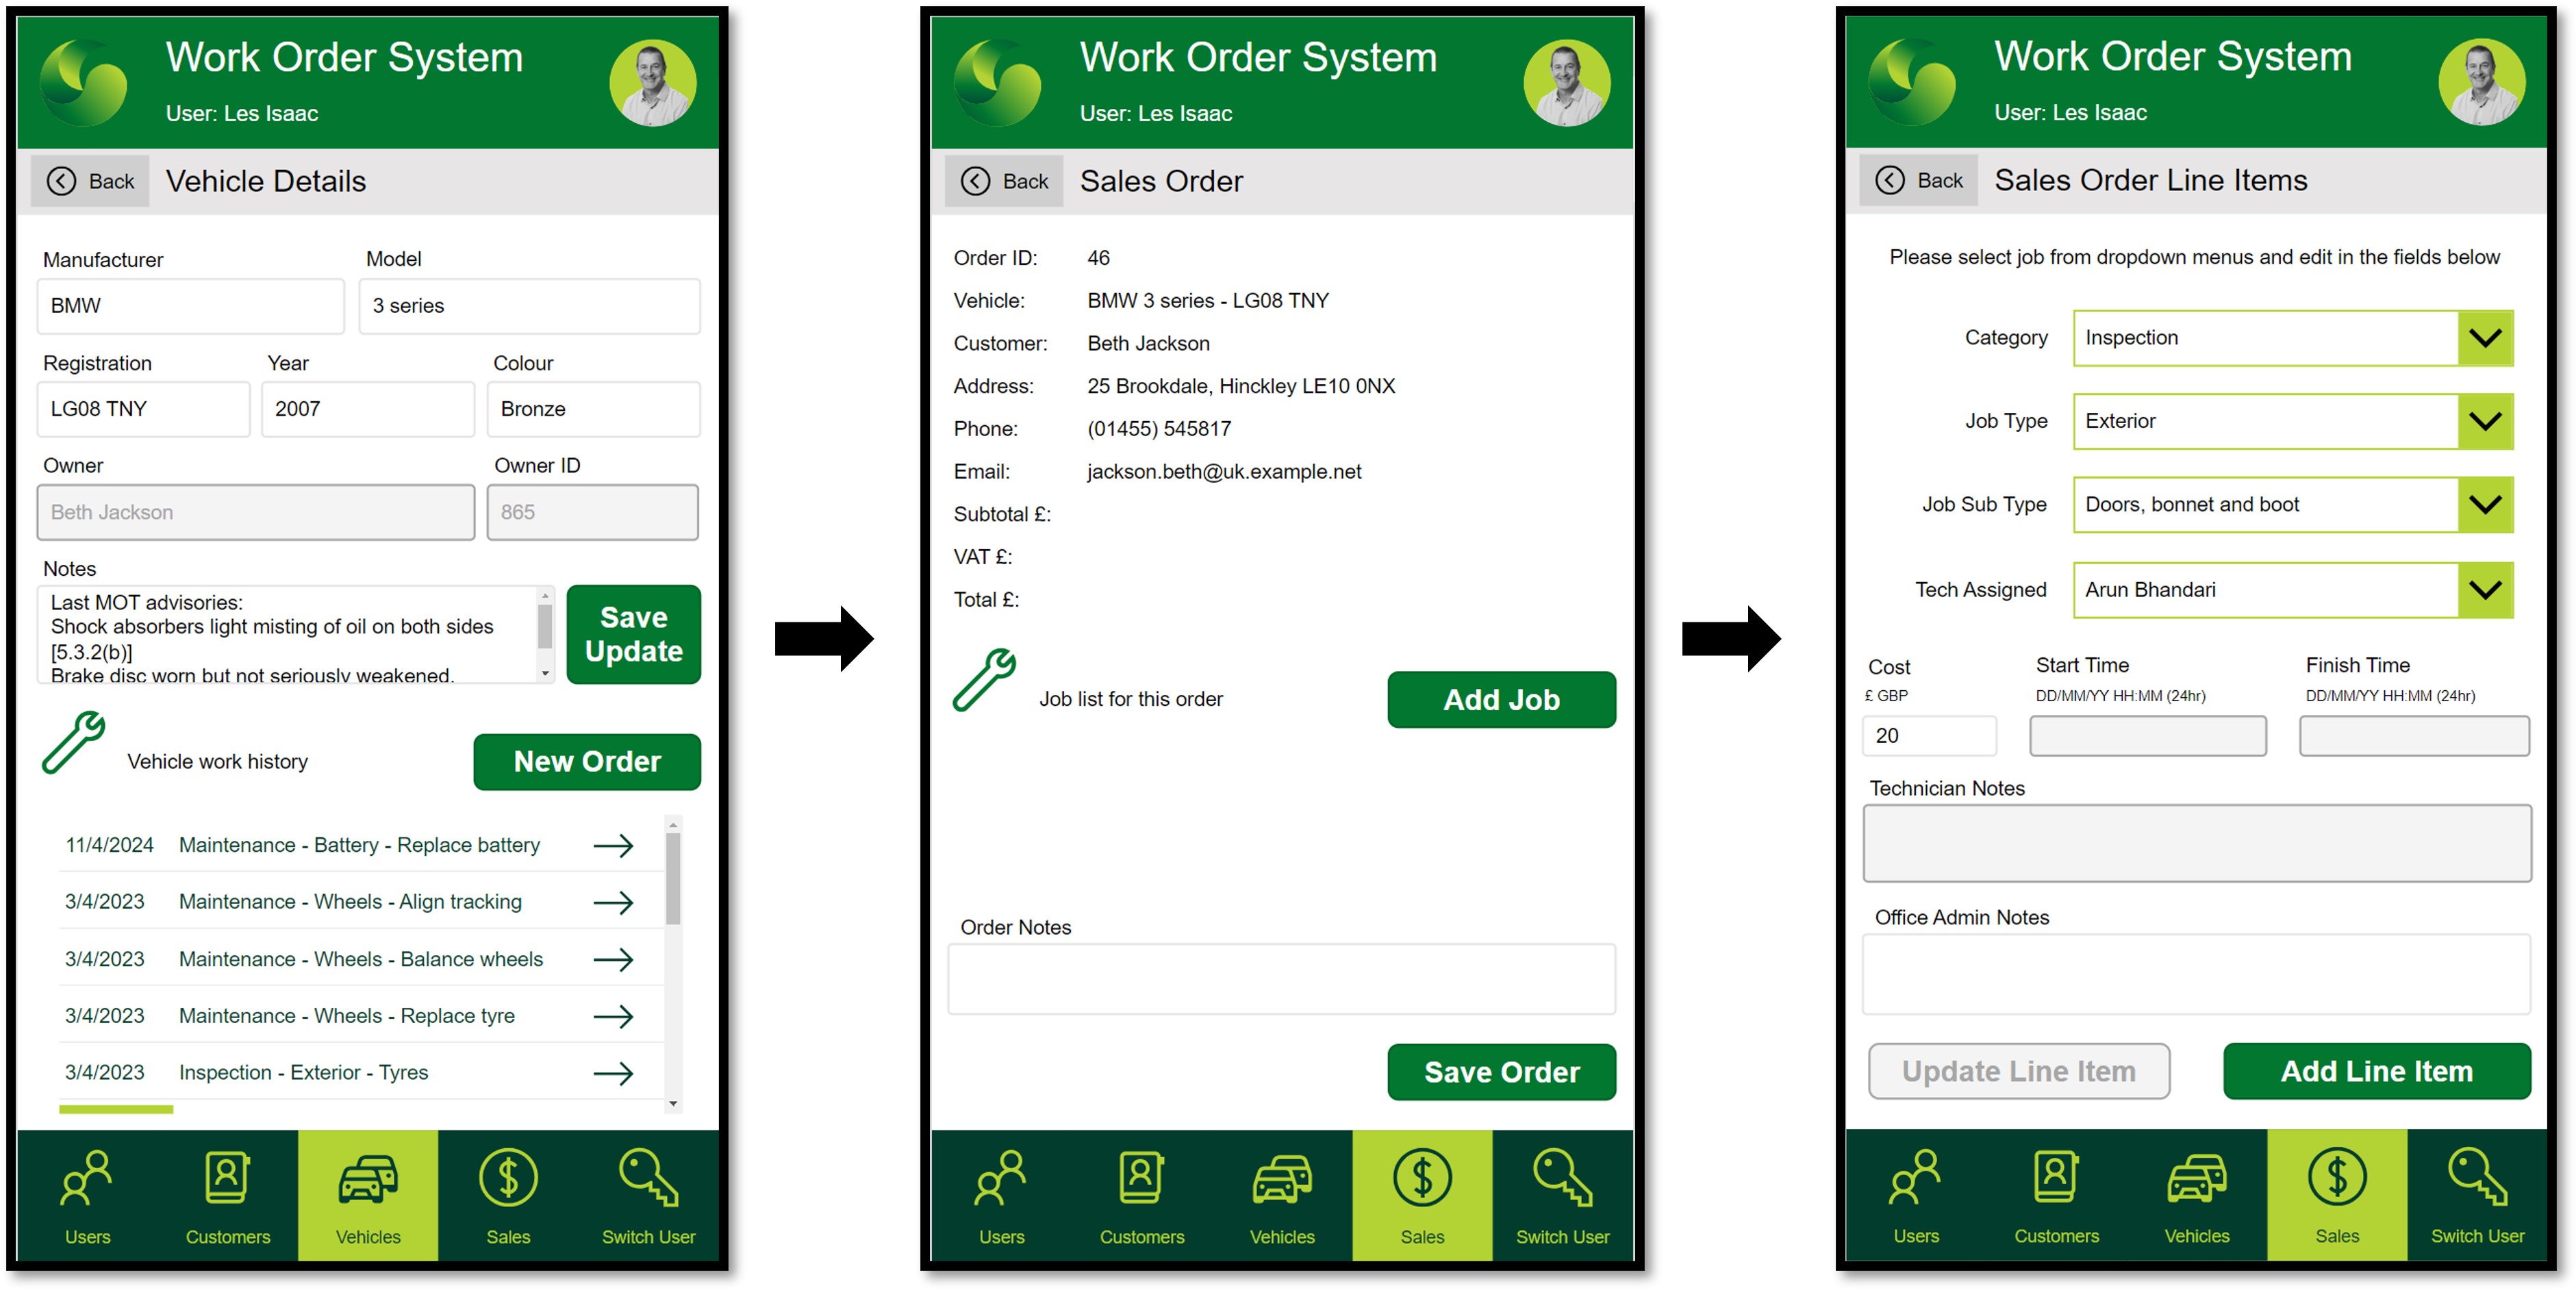
Step 7 – Design and develop your screens
With the groundwork complete, this is where you can enjoy being creative with the layout of, and controls used, in your screens. In this project I was experimenting with mobile layout design, but you can format for tablet or browser also. You can make your app look and feel just like apps you use every day, with dynamic menus tailored for the user. The screens below show the example navigation I discussed above, where the Admin user navigates through the system to generate a new order for a specific customer’s vehicle and then adds line items (jobs) to the order.
Step 8 – Develop your app further and leverage the Microsoft Power Platform
Once you have your database functioning correctly, there is so much you can do to extend the app’s capabilities, by leveraging the other applications within Power Platform. You can build automated workflows and rule-based alerts with Power Automate (for example when you want to notify a customer that their vehicle is ready for a service) and you can analyse the performance of the process and business with Power BI. You might extend your app with a booking system for customers to access directly and even offer a chatbot to customers for advice when they have a problem, using Virtual Agents.
Summary
It’s not as hard as many people think to create your own app and database solution. Low-code development with Microsoft Power Platform is ideal for processes that are too big to continue to run on Excel and manual emails, but not large enough to warrant the cost of a commercial “bells-and-whistles” system. With SharePoint lists as your database tables, you can create a cheap and simple, but powerful, solution. That’s a sweet spot that covers so many possible applications across any business.
Advantages of this approach include:
- Your app is streamlined to your needs; no unnecessary functionality and controls that would distract users.
- You can scale it as your process becomes more complex or choose to increase the functionality for different users of your app.
- By building capability in your team, if the project is important for you then you can go ahead and do it. There’s no longer a need to join a list of potential IT projects, where priorities and resources are out of your hands.
Are you drowning in labour intensive manual processes? Digital Operations Improvement solutions can automate internal process flow and create powerful customer experiences.
In today's fast-paced digital world, businesses must continuously improve their operations to stay competitive and meet customer expectations. Get in touch to discuss how our experts can help you streamline operations, enhance efficiency, and drive growth.