
Executing Data Visualisation to Upgrade a Static PDF into an Interactive Dashboard with Real-Time Insights
Executive Summary
A UK government regulatory body produces an annual report known as the Service and Delivery Report (SDR) that details the performance of 17 companies across various statutory metrics. To accompany the report, they was seeking to introduce an interactive dashboard that could be published online.
Reinvigoration was asked to perform a diagnostic of the Service and Delivery reporting process and implement the preferred solution. This solution was a fully automated and real-time dashboard using Microsoft Power BI.

The Challenge
The regulatory body produces an annual Service and Delivery Report (SDR) that details the performance of 17 companies across various statutory metrics. The report took a significant amount of time to produce, correlating the datasets across all individual jurisdictions and developing commentary was challenging and laborious. They wanted to revolutionise this report by introducing an interactive dashboard, comparing each water company on various metrics in a live, updating environment.
The Solution
Reinvigoration was asked to perform a diagnostic of the Service and Delivery reporting process, highlighting where the client could make better use of existing resources and implement automation and digitisation. Following our recommendations, we implemented the preferred solution.

The Outcomes
Reinvigoration helped them to:- Conduct an end-to-end process review, highlighting improvements to reporting process and opportunities.
- Design, develop, and test one of five options presented to the client, with on-time delivery and acceptance of the final dashboard.
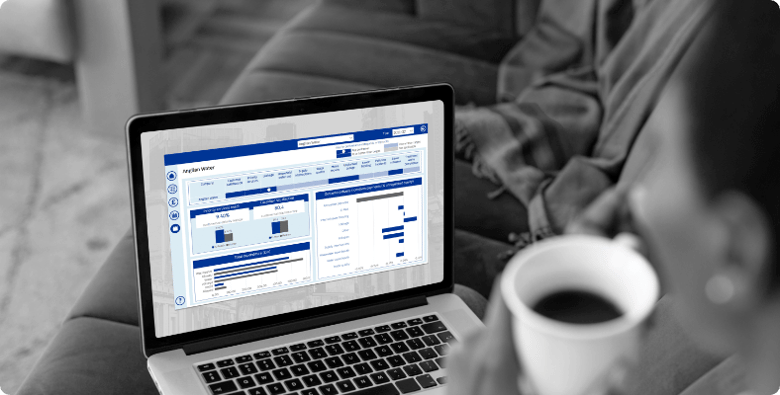
- Utilise Power BI to create a fully automated, interactive, and real-time dashboard.
- Optimise the dashboard for accessibility, providing easy navigation for keyboard and screen reader users. This dashboard was made available online to the public in November 2022.
- Put together a user manual and training for the employees to maintain the dashboard for future updates.
The Conclusion
Working with Reinvigoration empowered the UK government regulatory body to revolutionise the way they produce key yearly Service and Delivery reports. Through data visualisation, Reinvigoration changed a static PDF with a laborious creation process into an updatable, interactive dashboard that provides automatic real-time insights.